============================================================================
SOM for RH Panel construction

A new dog/hamster radiation hybrid panel with a higher resolution limit  
has been constructed by fusing dog primary fibroblasts irradiated at
9000 rads with thymidine kinase-deficient hamster cells HTK3 :

I ) Cells:  Dog primary fibroblasts were derived from two male mongrel  
dogs.  Hamster HTK3- cells (thymidine kinase defficient) were derived  
from A2H strain after 6BrdU selection.

II ) Irradiation/Fusion:  A) 20X106 Dog fibroblasts were irradiated  
with 9000 rad.  B) Chemically induced fusion was done using   
PEG2000+10% DMSO with 20X106 HTK3-cells (Dog/Hamster cell ratio = 1.0)

III ) Results: Five identical fusions were done which enabled us to  
produce 400 clones. Average fusion efficiency was 4 per 106 (4 clones  
for every 106 dog fibroblasts).  The 400 clones have been tested for  
their retention frequency using a set of 96 defined BAC markers.  88  
clones were selected and expanded, resulting in a panel with an average  
retention frequency of 29% and a resolution of 300 kb.

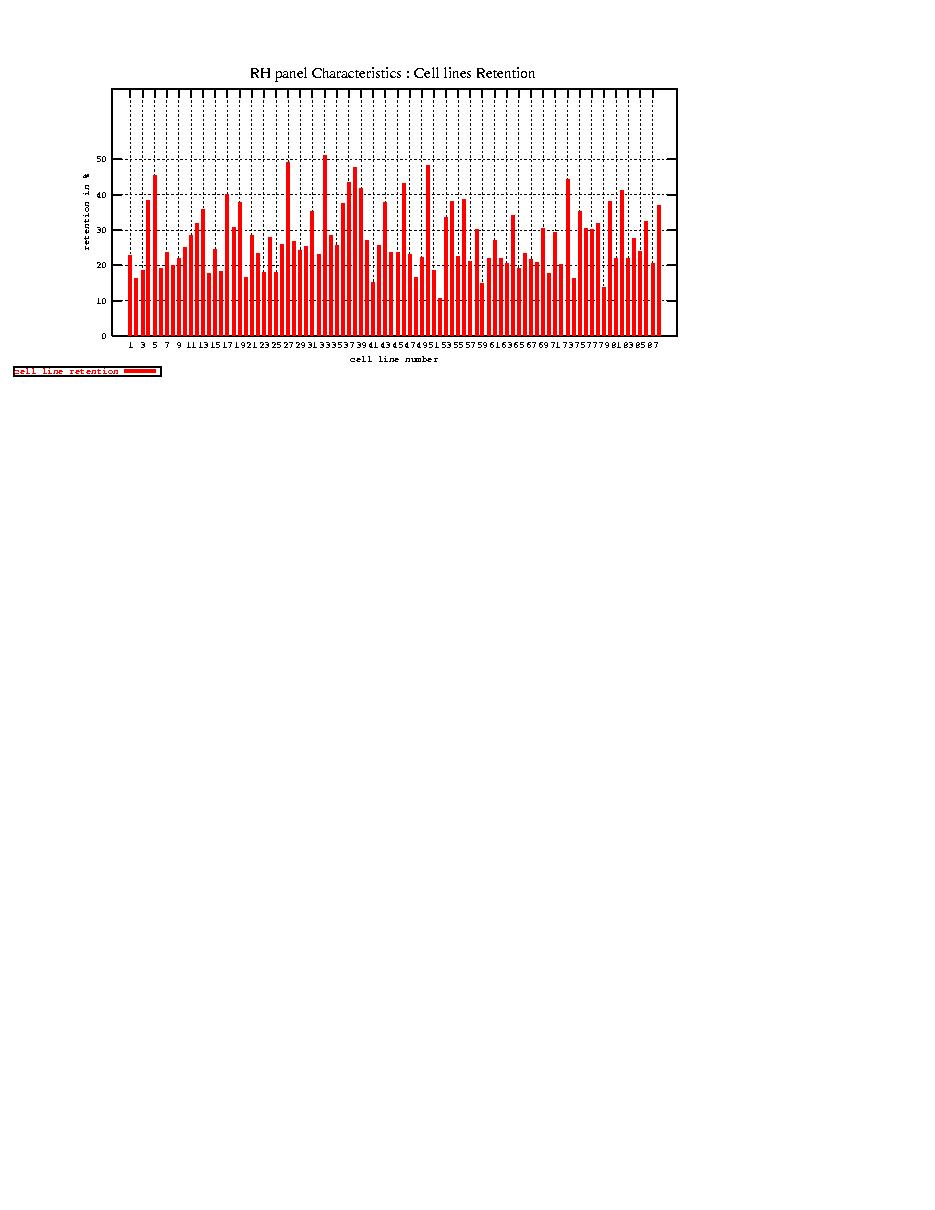
- Cell lines retention 
(percentage are derived from 10,500 RH genotyping data).
Cell Line n.1 = 23.0071 %
Cell Line n.2 = 16.3397 %
Cell Line n.3 = 18.6298 %
Cell Line n.4 = 38.3902 %
Cell Line n.5 = 45.3957 %
Cell Line n.6 = 19.1613 %
Cell Line n.7 = 23.8477 %
Cell Line n.8 = 20.0019 %
Cell Line n.9 = 22.0118 %
Cell Line n.10 = 25.2005 %
Cell Line n.11 = 28.4858 %
Cell Line n.12 = 32.0224 %
Cell Line n.13 = 35.7909 %
Cell Line n.14 = 17.7215 %
Cell Line n.15 = 24.5531 %
Cell Line n.16 = 18.4559 %
Cell Line n.17 = 40.0425 %
Cell Line n.18 = 30.7952 %
Cell Line n.19 = 37.8104 %
Cell Line n.20 = 16.7552 %
Cell Line n.21 = 28.4279 %
Cell Line n.22 = 23.5578 %
Cell Line n.23 = 18.1177 %
Cell Line n.24 = 27.8771 %
Cell Line n.25 = 18.0501 %
Cell Line n.26 = 26.0798 %
Cell Line n.27 = 49.3091 %
Cell Line n.28 = 26.7949 %
Cell Line n.29 = 24.2246 %
Cell Line n.30 = 25.4517 %
Cell Line n.31 = 35.4334 %
Cell Line n.32 = 23.2969 %
Cell Line n.33 = 51.0387 %
Cell Line n.34 = 28.5148 %
Cell Line n.35 = 25.674 %
Cell Line n.36 = 37.5882 %
Cell Line n.37 = 43.5791 %
Cell Line n.38 = 47.8404 %
Cell Line n.39 = 41.8688 %
Cell Line n.40 = 27.0268 %
Cell Line n.41 = 15.3445 %
Cell Line n.42 = 25.7996 %
Cell Line n.43 = 37.965 %
Cell Line n.44 = 23.5965 %
Cell Line n.45 = 23.7318 %
Cell Line n.46 = 43.2022 %
Cell Line n.47 = 23.21 %
Cell Line n.48 = 16.533 %
Cell Line n.49 = 22.2534 %
Cell Line n.50 = 48.2655 %
Cell Line n.51 = 18.5718 %
Cell Line n.52 = 10.5904 %
Cell Line n.53 = 33.5395 %
Cell Line n.54 = 38.1486 %
Cell Line n.55 = 22.5722 %
Cell Line n.56 = 38.738 %
Cell Line n.57 = 21.1711 %
Cell Line n.58 = 30.1092 %
Cell Line n.59 = 15.0449 %
Cell Line n.60 = 21.9152 %
Cell Line n.61 = 27.1041 %
Cell Line n.62 = 22.0118 %
Cell Line n.63 = 20.6687 %
Cell Line n.64 = 34.0613 %
Cell Line n.65 = 19.1323 %
Cell Line n.66 = 23.3936 %
Cell Line n.67 = 21.7992 %
Cell Line n.68 = 20.8909 %
Cell Line n.69 = 30.5827 %
Cell Line n.70 = 17.7215 %
Cell Line n.71 = 29.3458 %
Cell Line n.72 = 20.3015 %
Cell Line n.73 = 44.4487 %
Cell Line n.74 = 16.2335 %
Cell Line n.75 = 35.2401 %
Cell Line n.76 = 30.3701 %
Cell Line n.77 = 30.1962 %
Cell Line n.78 = 32.0128 %
Cell Line n.79 = 13.9434 %
Cell Line n.80 = 38.2452 %
Cell Line n.81 = 21.9152 %
Cell Line n.82 = 41.2407 %
Cell Line n.83 = 22.1084 %
Cell Line n.84 = 27.7708 %
Cell Line n.85 = 23.9443 %
Cell Line n.86 = 32.3799 %
Cell Line n.87 = 20.6977 %
Cell Line n.88 = 37.0374 %

RH panel average retention : 29 % 
Histogram of cell line retention [-full size-]
panel 10K retention
==================================================================================== SOM for Markers identification All canine sequence were identified through BLASTn best mutual alignement with the human genome.Human genes that had a representative dog sequence were allotted to 11818 bins . The human genome was split into 75 kb segments and the sequence providing the highest blastn score in each of the 11818 binsAlignment was retained whenthe dog/human alignment overlaps at least one human exon defined by the 24,567 genes of Ensembl version 13.31.1 All selected dog sequences are contigs or singletons, derived from the assembly of 6.22 million reads. All dog sequence were searched against the human genome (NCBI 31) by blastn. Selection criteria :
  • 1. Blastn alignment with human genome yields mutually-best HSPs. HSPs are defined as mutually-best when the segment of aligned dog sequence has no higher-scoring hit elsewhere on the human genome AND the segment of aligned human sequence has no higher-scoring alignment with another dog sequence.
  • 2. The dog/human alignment overlaps at least one human exon Defined by the 24,567 genes of Ensembl version 13.31.1
  • 3. The dog sequence is not a processed pseudogene Where multiple HSPs were separated by <25 bases on a dog sequence, but >300 bases on the human sequence, the dog sequence was considered as a potential pseudogene, and was eliminated.
  • 4. The dog/human alignment includes only part of the dog sequence A dog sequence for which the alignment extended over the complete length of the dog sequence may not yield dog-specific primers, and was eliminated.
  • 5. After applying criteria 1-4, selection of a single dog sequence for each human gene The sequence providing the highest blastn score.
  • 6. Human genes that have a representative dog sequence were allotted to 11818 bins i.e. The human genome was split into 75 kb segments. If multiple human genes fell within a single segment, these were binned together.
  • 7. Selection of a single dog sequence for each 75 kb bin The sequence providing the highest blastn score in each of the 11818 bins.
  • 8. Selection of a dog sequence from alternate bins This gave 5909 sequences for the first round of mapping. There remains another 5909 dog sequences from the remaining 75 kb bins that can be used for the second round. ================================================================================ SOM for Map construction Map construction was carried out with the rh_tsp_map2 package (Agarwala et al. 2001) that uses the well-known state of art CONCORDE algorithm in the TSP problem (Applegate et al.) The RH vectors were analysed by pairwise analysis using the pairlods_dists option to constitute linkage groups. The Traveling Salesman Problem (TSP) method using the CONCORDE chained Lin-Kernighan algorithm of the rh_tsp_map2 package was used to order of each linkage group. Parametric and non-parametric analysis is systematically provided resulting in 5 independent maps. A consensus map could be derived from the 5 independent maps along with a mapping support expressed in percentage assigned to each marker.
    map interpretation
    
    
    Legend :
    
    
    The rh_tsp_map2 program delivers 5 maps. Results of the comparison of these five maps is enlighted by horizontal bars. When the same marker is present in the five maps at a given position the horizontal bars have a maximum length and correspond to mapping positions reaching high confidence ( i.e. box 1). Map positions occupied by two or more markers are characterized by shorter horizontal bars (i.e. boxes 2 and 3). Although as in box 2 a given marker can occupied three different positions extending the size of the scrambled region, in box 3 only two adjacent markers exchange their positions limiting the zone of uncertainty
    from Hitte et al. 2003
    ================================================================================ SOM : MAP RESOURCES
  • ALL RH vectors are available : [ -download vectors- ]
  • ALL gene sequences are available : [ -download sequences- ]
  • The High resolutive canine RH panel is available upon request : [- ask for RH panel -]